Misery, Velocity, and the Github for the new financial analysts
With or without a Finance 101 course in your history, it is normal to gravitate towards known metrics and analytics for the new asset class of cryptocurrencies and tokens. Technical analysis is being used left and right for long and short-term trends, by all the crypto-exchanges and the new “research” subscription sites. Metrics that can be categorized as fundamental ones are being discussed as we speak on Twitter chats, at conferences and businesses are being built to serve this conventional need. Institutional appetite, the recent surge of M&A between Wall Street incumbents and crypto, increased listings on exchanges of derivative (structured products and futures) is also beckoning for more of the conventional structure.
The market is looking for crypto economists, cryptoanalysts, and all the models, tools and ways that we built over the years for stocks, bonds, derivatives, etc. I shared publicly my thoughts on “A Wall Street perspective of Crypto as an alternative asset class” at the CryptoMountains Rocks unconference in Davos in late March. It had strong elements of a stand-up comedy to make sure that the 40min on stage (stuck in a chair due to my then fresh injury) was not going to put the audience to sleep.
New technical tools from incumbents
From the incumbents’ world, we already have Thomson Reuters that has a developed a Bitcoin sentiment gauge for traders in collaboration with MarketPsych Data, a sentiment analytics company using behavioral economics using NLP and ML. These sentiment gauges will be developed for other cryptocurrencies soon.
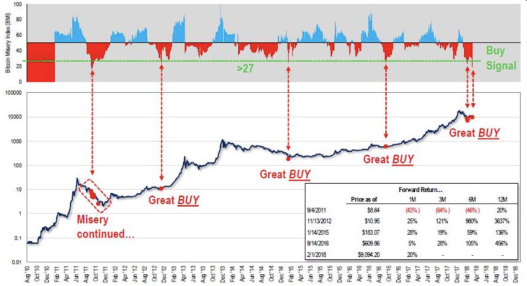
Fundstrat Global Advisors, a traditional independent research, and strategy US firm, has developed the Bitcoin Misery Index (BMI) which is designed as a trading tool for investors to take advantage of volatility in BTC exchanges. BMI is calculated on a scale of zero to 100, taking into account factors such as volatility and the number of winning trades out of the total. When the indicator is low, the buying opportunity is at its best, and vice versa. Thomas Lee, the co-founder of FG says “When the bitcoin misery index is at ‘misery’ (below 27), bitcoin sees the best 12-month performance. A signal is generated about every year,” “When the BMI is at a ‘misery’ level, future returns are very good.”

Source: Fundstrat March 9, 2018
Fundamental tools 101
The book of Chris Burniske and Jack Tatar “Cryptoassets: The Innovative Investor’s Guide to Bitcoin and Beyond” published last October is a must. The authors cover the basic fundamental framework for thinking about cryptocurrencies.
First, we all agree that their value has a utility component and a speculative component. You can think as the speculative part, as the number of bitcoins that are held out of circulation as an investment.
The utility component can be captured by estimating the actual usage. For example, if 100,000 merchants are using bitcoin for their international trade transactions and those average 100,000USD per trade; then the number of bitcoins needed are 1.25milBTC (at a rounded price of $8,000/BTC). This is an estimate of the current utility value.
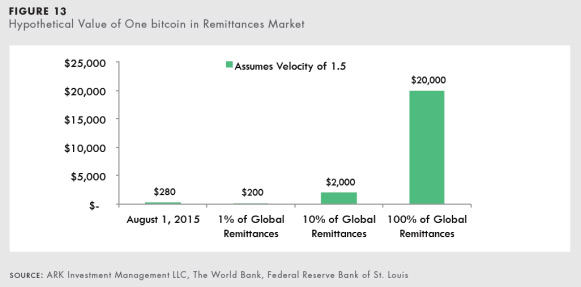
Then, we need to consider the velocity of Bitcoin, much like we look at GDP and divide by the money supply. We can start by making assumptions about the remittance market and if we expect that bitcoin may be used for 20% of that market, then say the global remittance market is 500billion then divide by max amount of bitcoin and get a value. Then assume, bitcoin grabs 10% of the gold market as a store of value, you do the same calculations.
Finally, one has to decide a discount rate. Based on this kind of framework, one can get some theoretical boundary valuations.

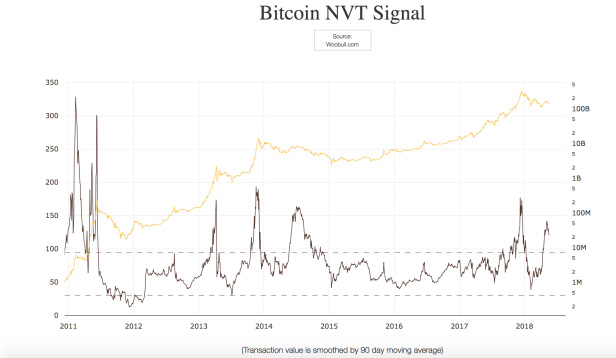
The one metric that is now floating around (despite its limitations) is the NVT which is seen as a PE analog from the stock market. The NVT ratio measures the dollar value of a crypto asset transaction activity relative to the network value. This is a simple way to compare how the market values one unit of on-chain transactions across different networks. Generally speaking, a “low” NVT indicates an asset which is more cheaply valued per unit of on-chain transaction volume. The main shortcoming of NVT is that it is lagging and it is not a powerful short term indicator (which, unfortunately, now is more in focus since the speculative component is overwhelmingly higher than the utility component in most cryptos). Willy Woo, who analyses crypto assets discusses thoroughly the nuances around using the NVT ratio charts or the smoothed out NVT signals by Dmitry Kalichki.
More on Fundamentals
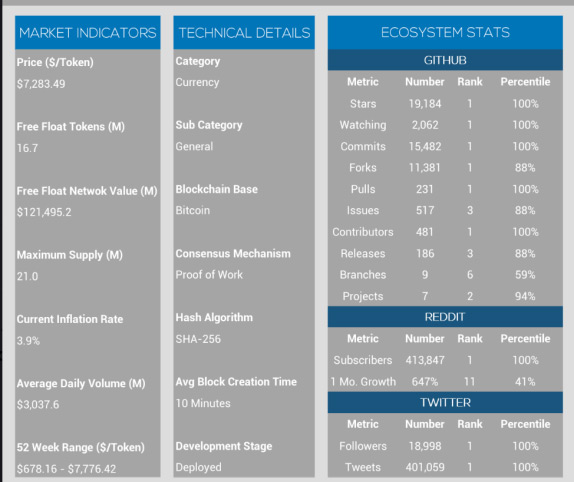
Digital Asset Research is a startup that wants to become a top independent cryptocurrency research player.

In their standardized research reports, they include many indicators of the new fundamental metrics. These give metrics around inflation, actual usage from developers, the network, and the competitive landscape. Ivan on tech is not the only one, that has been using raw data and stats from the Github to analyze altcoins.
The first decentralized and or crowdsourced fundamental research platform with data and analytics are just being built as we speak. I will cover these in an upcoming post. If you know of any such ventures, please note them in the comments below.
Notes: Next year’s CryptoMountainRocks is on 21-23 March in Davos of course. Skiing in the morning, talks and battles in the afternoon. Watch the recording of my talk here:


